Over the weekend, the NYTimes ran an article titled “Baby Makes Four, and Complications” which tells the story of a woman, her son, her sperm donor and his lover, citing them as an example of the changing face of the American family.
This was no big news to me. After all, the idea of the traditional nuclear family is being questioned every day, and for the first time ever, the percentage of households headed by married couples has dropped below 50 percent (according to 2010 U.S. Census figures).
What particularly caught my eye about the article was its accompanying interactive webpage, “How Many Households Are Like Yours?” Upon entering the page, the visitor is prompted to choose the primary residents of his/her household, to see how their household compares to the rest of America, and to explore how the different types of American families have changed over time.

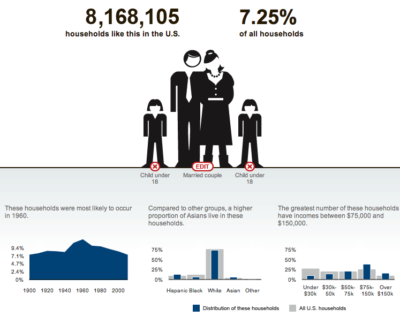
I quickly entered our household stats: a married couple with two children (BebeDeux isn’t born yet but she still counts in my eyes) under the age of 18. Here is how we stacked up:

I was pretty surprised by the results — I really believed that a married couple with two kids would account for more than 7.25% of all U.S. households!
It was also interesting to note that compared to other groups, a higher proportion of Asians live in our type of household, and how we fit right into the $75k-$150k income category. (I guess we are pretty stereotypical? 😉 )
How does your household compare? Are you at all surprised by the statistics?